
Activity – Infographics 1: Creating a Pie Chart in Excel
[This section should take you around 25 minutes to complete]
A pie chart is used to show portions of a whole. Use it to show numbers that relate to a larger sum and are always equal to 100%. Do not use a pie chart if it contains many slices.
For this task, you will create a chart showing the fraction in per cent (%) of Australian exports for July, August, and September 2017.
Question: Think about why only exports are included in this pie chart. Why wouldn’t the Imports also be included here?
Answer: A pie chart enables us to compare the portions of a whole, so you can only view and compare the monthly export data. To compare the monthly import data, you will need to create a separate pie chart. You must create a column graph to compare monthly imports to exports (refer to Excel Activity 5).
- Open the file Your Name TEP021 Excel 5.xlsx from week 3.
- Save As Your Name TEP021 Infographics 1.xlsx
You should see the table below:
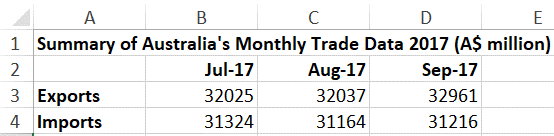
3. Select A2:D3.
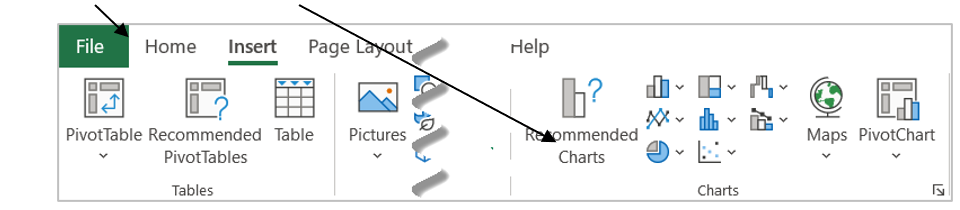
4. On the Insert tab, click Pie chart and select 3-D Pie.
5. On Chart Design tab, click Quick Layout and select Layout 1.
- Each section of the chart is labelled with a year number and percentage.
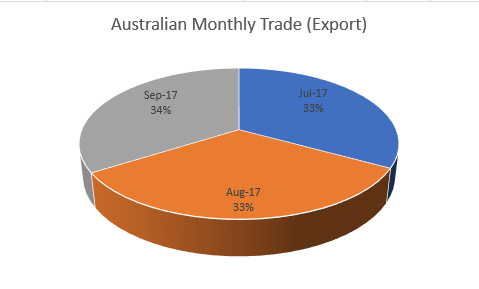
2. Rename the chart title by clicking on it and typing Australian Monthly Trade (Export).
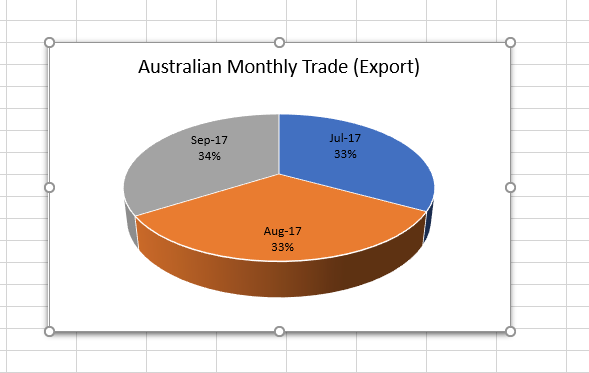
3. Since this chart will be pasted into a Word document, it is important that the background remains blank. No background fill colours should be added as this can detract from the information provided.
4. Make sure the chart and the data table do not split across 2 pages in Page Layout view.
5. Update the header with the current date on the right.
6. Update the activity name in the footer on the left.
7. Save your worksheet and keep it open.
Incorporating your graphic into Word
8. Open Word to get a new blank document.
9. Save As Your Name TEP021 Infographics 1.doc
10. From Excel, click on the newly created pie chart and select copy from the Clipboard ribbon. You can also right-click and select copy.
11. In your blank Word document, click anywhere and select Paste.
12. Add the captions and labels in Word by following the next instructions.
13. Click on the image to select it.
14. From the References menu, click “insert caption”.
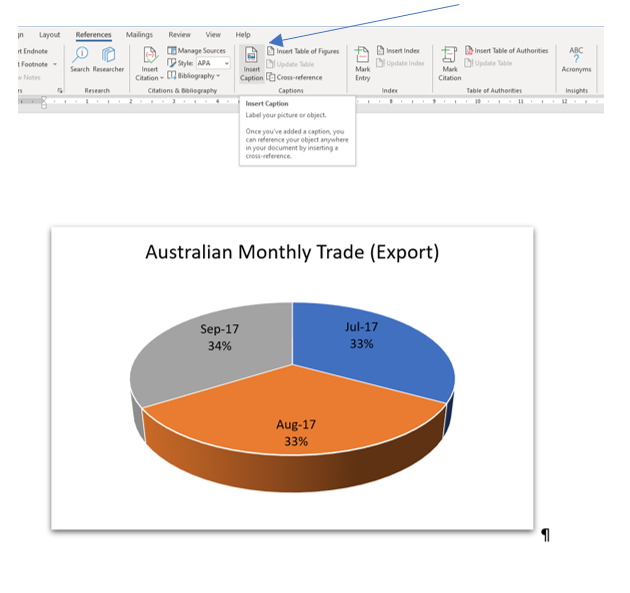
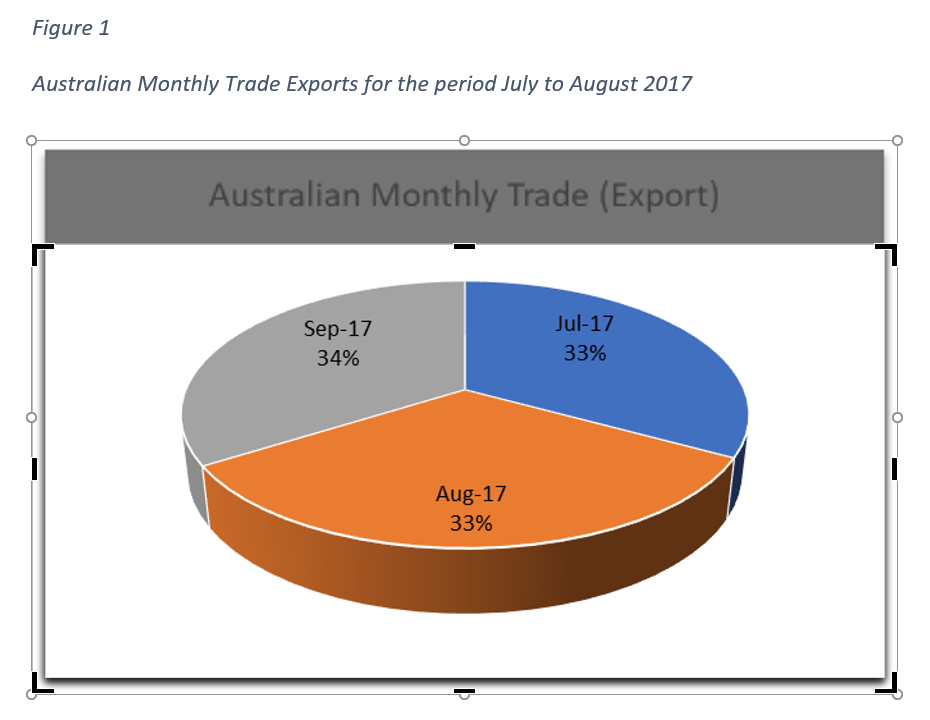
15. From the “Insert Caption” menu, select Figure as the Label and type “Australian Monthly Trade Exports for the period July to August 2017” in the Caption line.
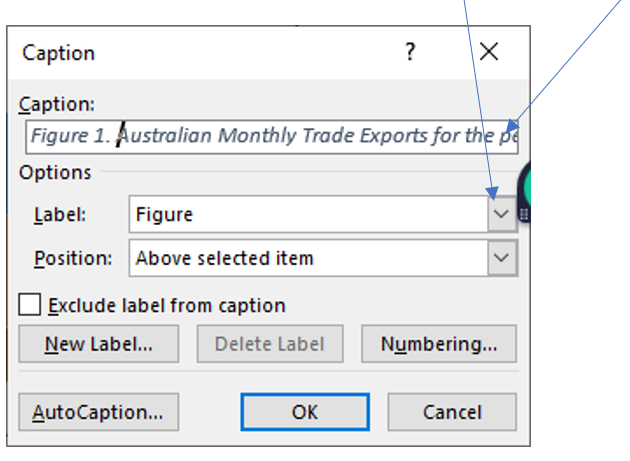
16. You will notice that the Caption is added to the top of the image.
Note: in Scientific and technical writing, the location of the title should be below the figure.
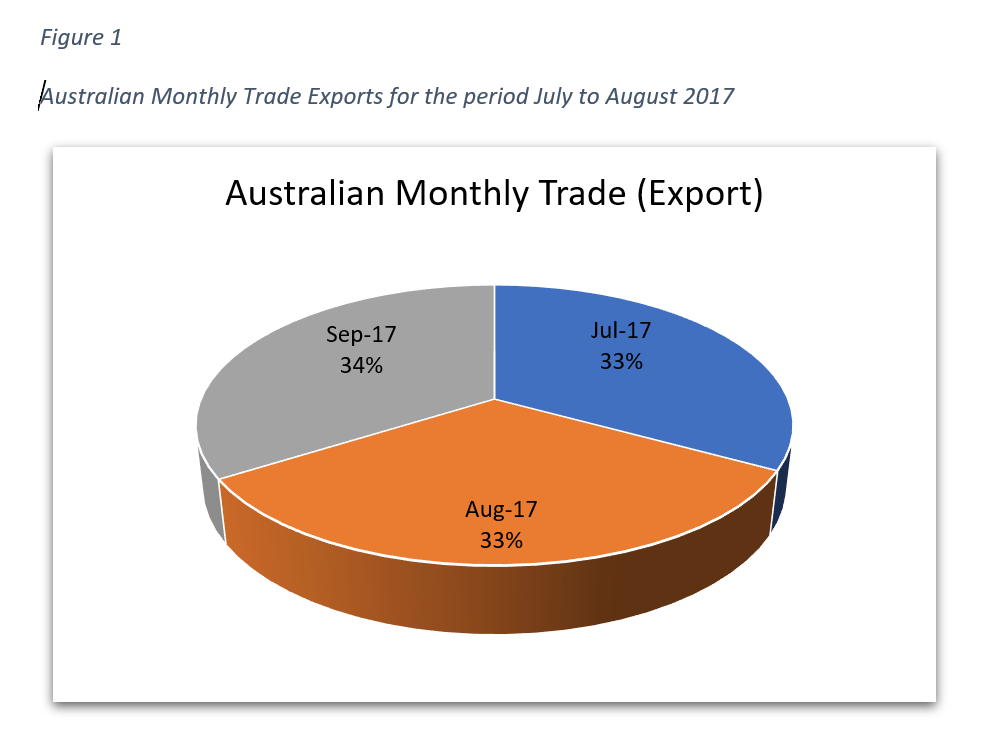
17. Add a space between the Label “Figure 1.”, and the rest of the title so that it looks like the image below. Hint – you may need to click on the caption and resize it to fit all the text.
18. You will now notice that you have two titles. We don’t usually use the titles from Excel as they are often brief and not formatted correctly. For future tasks, avoid adding a title in Excel if you are going to paste the chart in a Word document. For now, however, you can crop the top part of the image to remove the old title.
Click on the image and select “Crop” from the “Picture Format” Ribbon. 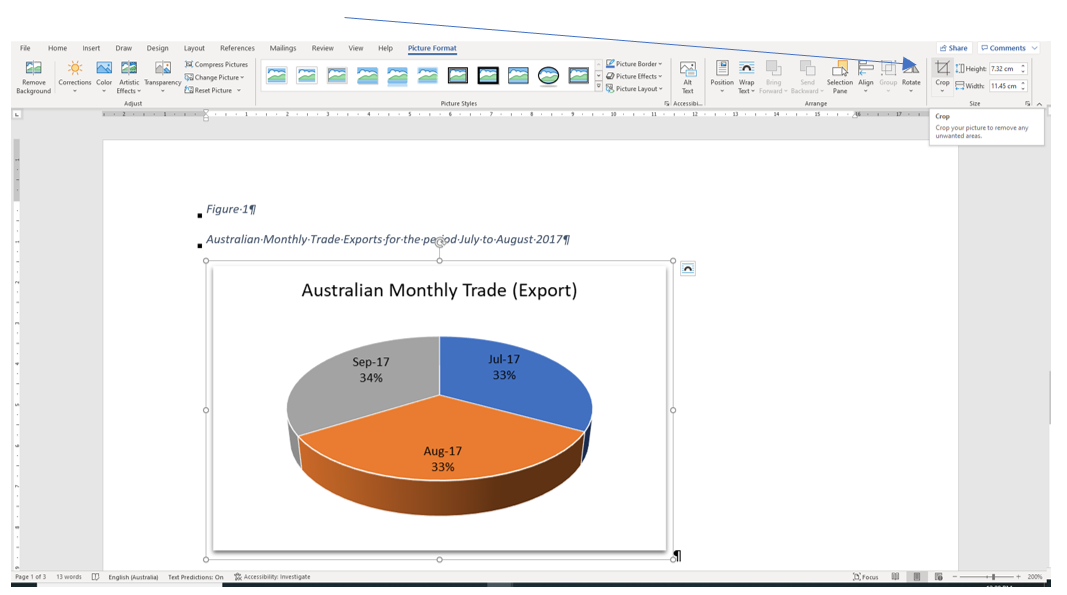
Note: if you do not see the “crop” option, it may be that you pasted the image with a link to the data in Excel. To resolve this, copy the image again and “Paste as Picture”.
19. You will see that the image handles have changed from small circles to short lines
20. Click and hold the top handle and drag this down until the original title has been removed as shown below.
- Click anywhere on the page to confirm the changes.
- Add a header to the Word document with your name and student number on the left, and date on the right.
- Add a footer to the Word document with the unit code and activity name and number on the left, and a page number on the right.
- Save your document to the Documents folder on your computer and close Word.
- Close your Excel workbook.
- Upload the completed activities document to the TEP021 Activities folder on OneDrive.