
Activity – Infographics 2: Creating graphics in Word
Instructions for Creating an Infographic in MS Word
[This section should take you around 25 minutes to complete]
Step-by-Step Guide
1. Open a new Word document and Save As Your name TEP021 Infographics 2.doc
Insert an image:
2. Use this link to insert the image: “Man working on computer thinking” https://pixabay.com/vectors/man-working-computer-thinking-male-311353/
Add a Callout:
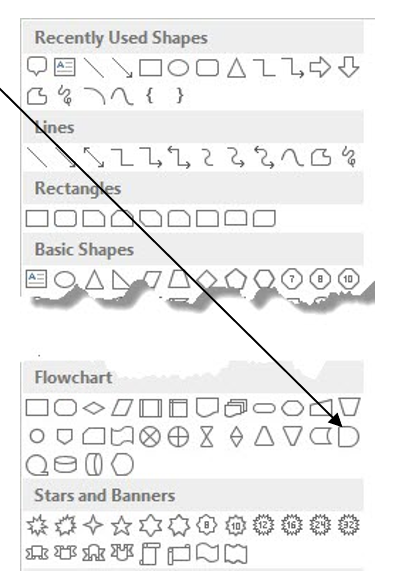
3. Click the Insert tab and select Shapes.
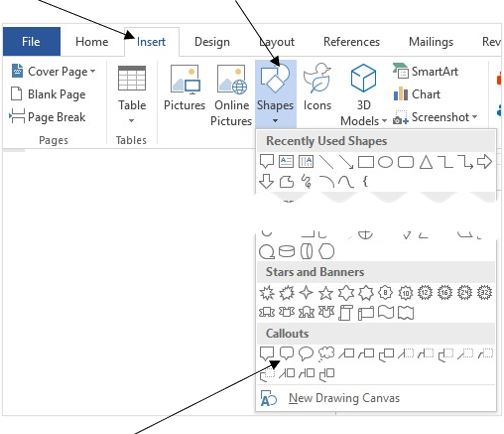
4. Click on Rounded Rectangular Callout. The mouse pointer becomes a cross.
5. Click and drag the mouse pointer above the man’s head to draw a callout balloon.
6. Click and drag the yellow dot to extend the pointer very close to the head of the man.

Format the callout:
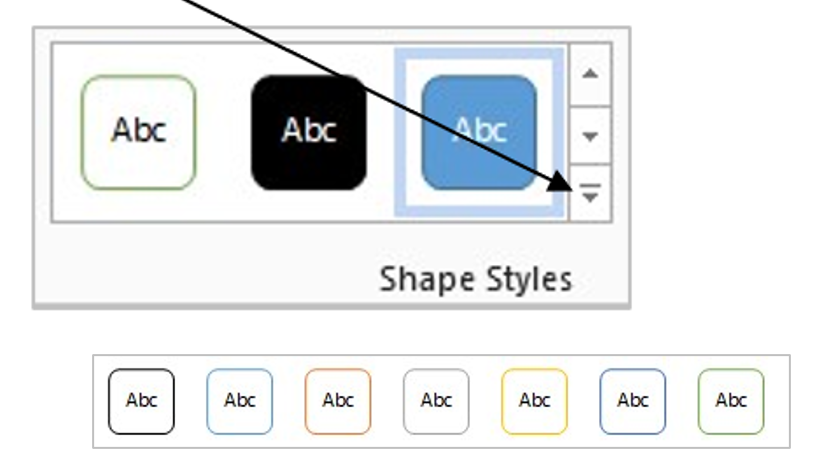
7. Click the More button ![]() of the Shape Styles group.
of the Shape Styles group.
8. Select a style with a white background.
9. Inside the callout Type “28%” and press Enter.
10. Type “Sprains, strains or dislocations are the most common workplace injury in 2023-2024 (Safe Work Australia, 2024)”.
We will add a reference a little later on.
11. Resize the callout using the handles around it to accommodate all text.

12. Click anywhere outside the callout balloon to deactivate it.
Insert and format shapes:
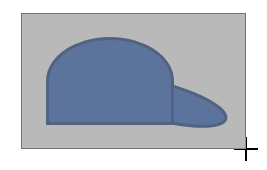
13. Click the Insert tab and select Shapes, then click on Oval
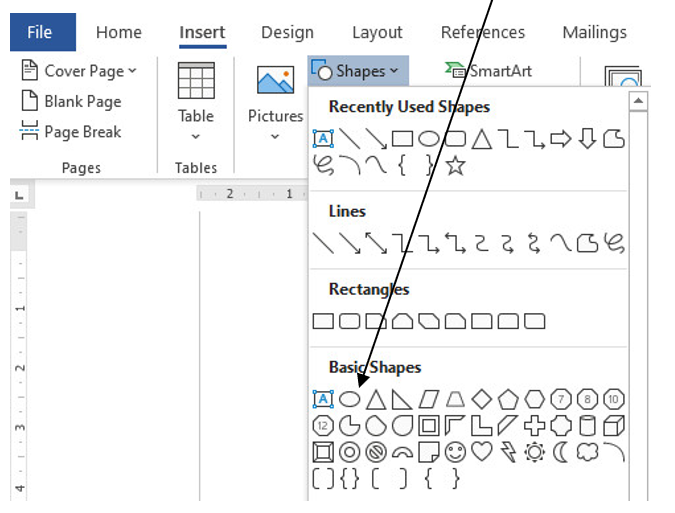
14. Click and drag to draw an oval on the white area of your document

15. Click the More button in the Insert Shapes group
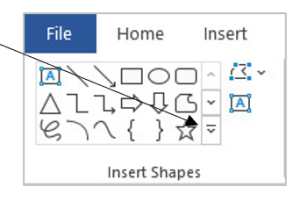
16. Click Flowchart: Delay
17. Click and drag to draw an object.
18. Click and hold the rotating handle and then drag to the left to rotate.
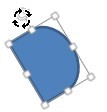
19. Move the oval and the Flowchart: Delay to create a cap.

20. Click the oval to select it.
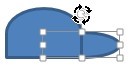
21. Click and drag the rotating handle of the oval to rotate and adjust the position to look more like a cap


Grouping objects
Grouping lets you rotate, flip, move, or resize all shapes or objects at the same time as though they were a single shape or object. You can also change the attributes of all of the shapes in a group at one time, by adding a shape fill or shape effect, for example. You can select an item within a group and apply an attribute without ungrouping the shapes, or you can create groups within groups to help you build complex drawings.
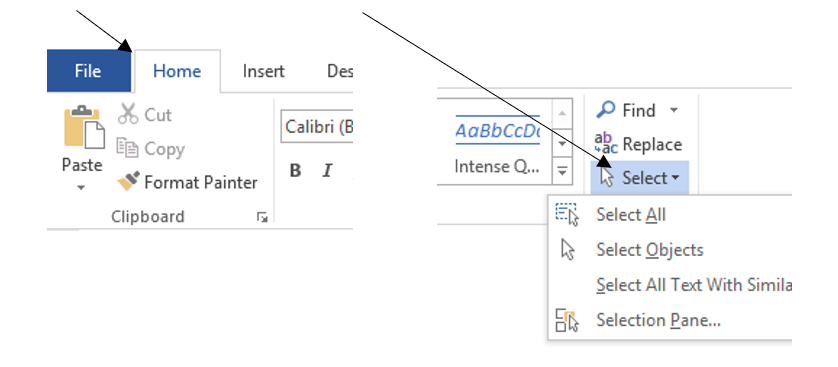
22. On the Home ribbon, click Select and then Select Objects
23. Click and hold down the left mouse button and draw a big rectangle over the cap.
24. All components of the cap are selected when the mouse button is released.
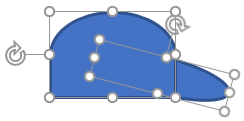
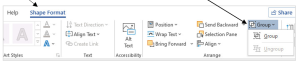
25. Click Shape Format tab, then click Group and Group.
Now you can move the cap as one single object around in your document without worrying that it may fall apart.
Changing the Attributes of Objects
You can change the look of a shape by changing its attributes, such as fill, outline, and shadow.
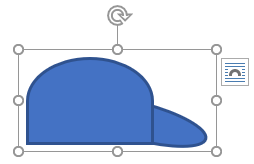
26. Click the cap if it is not active/selected.
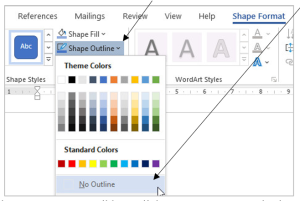
27. On the Shape Format ribbon, click Shape Outline and select No Outline.
The shape outlines are removed.

28. Move the cap onto the head of the person. Resize and rotate the cap to fit the head.
Notice that the cap has blocked the pointer of the callout. We will fix it later.

29. Click the callout balloon to select it.
30. On Shape Format ribbon, click Bring Forward and select Bring to Front.
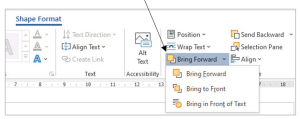
Notice that the pointer of the callout was behind the cap and now it is brought to the front.
31. Select the cap, then click Shape Fill and select the colour Blue, Accent 1, Lighter 40%.
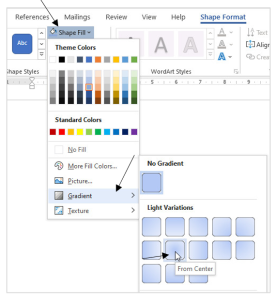
32. Click Shape Fill again and select Gradient then From Centre in the light Variations group.

33. Adjust the pointer if required.
34. Select the callout, cap, and person and group them into one object.
Insert an Image Attribution
35. Copy the following sentence and use the “Insert caption” tool to add an attribution below the infographic.
Adapted from Man working on computer thinking [Clip Art], by Clker-Free-Vector-Images, 2014, Pixabay. (https://pixabay.com/vectors/man-working-computer-thinking-male-311353). Pixabay License.
Note that since the image has been modified, it’s not the original. The word “Adapted” is therefore included at the beginning of the attribution and a lowercase letter “f” for “from”.
Do not include “Figure 1”. the title can be added later when the infographic is used in a document.

36. Click and drag the image around to see if all components (callout, cap, picture) go together. If not, re-group the image.
37. Add the following reference list under the image:
Reference
Australian Bureau of Statistics. (2024). Work-related injuries. https://bit.ly/3QKmD9H
38. Add a header with your name and student number on the left, and date on the right.
39. Add a footer with the unit code and activity name and number on the left, and a page number on the right.
40. Save and close your document.
41. Upload the completed document to the TEP021 Activities folder on OneDrive.
Organising data for an infographic
Now that you have learned about infographics, you will be able to begin creating your own infographics using data you have collected or located from another source such as a report or website. The following exercises will help you practice this skill.