
How to label a figure or a table
So how do you properly label a table or figure, and how are they numbered? To simplify the process, follow these steps:
- Figures and tables should have numbered captions with a descriptive title so that they can be identified by the reader and easily referred to.
- Charts, diagrams, illustrations, photographs, and maps are labelled as Figures.
- Tables are labelled as Tables.
- Table captions are placed above a table.
- Figure captions are placed above a table if using the APA writing style but are written below the figure if writing in science (such as Bioscience) or technical disciplines.
- Figures and tables are numbered sequentially
e.g., Figure 1, Figure 2, Table 1, Table 2, Figure 3, … etc. - If you are writing a long academic document (for example more than 2,000 words), it is recommended that the figures and tables are numbered consecutively within each section.
e.g., Figure 1.1, Figure 1.2, etc. - Include a reference (attribution) of the original source at the bottom of the figure or table. For tables and graphs, this is added as a Note and includes any information that helps to explain the table such as definitions of abbreviations.
How to insert a caption in Word
It can be difficult to keep track of the table and figure numbers if you have a few in your document. Thankfully Word has a special feature that allows you to insert a caption that is linked to each table or figure. It also sorts out the formatting to give it that professional look. You can add a caption at the top or bottom of the infographic, depending on the formatting required.
You will learn how to insert a caption in the next task when you create an infographic (Activity – Infographics 1).
To learn more about how to correctly set up a figure or table in your documents review the APA style guide:
https://apastyle.apa.org/style-grammar-guidelines/tables-figures
Creating your own infographic
Often you may be required to create your own infographic to help to explain your topic. For example, you may need to design a figure to match the data that you collected or to design a chart that helps explain an organisational structure or an idea.
The table below describes some common types of Infographics and how they can be used.
Table 1
Common types of illustrative graphics
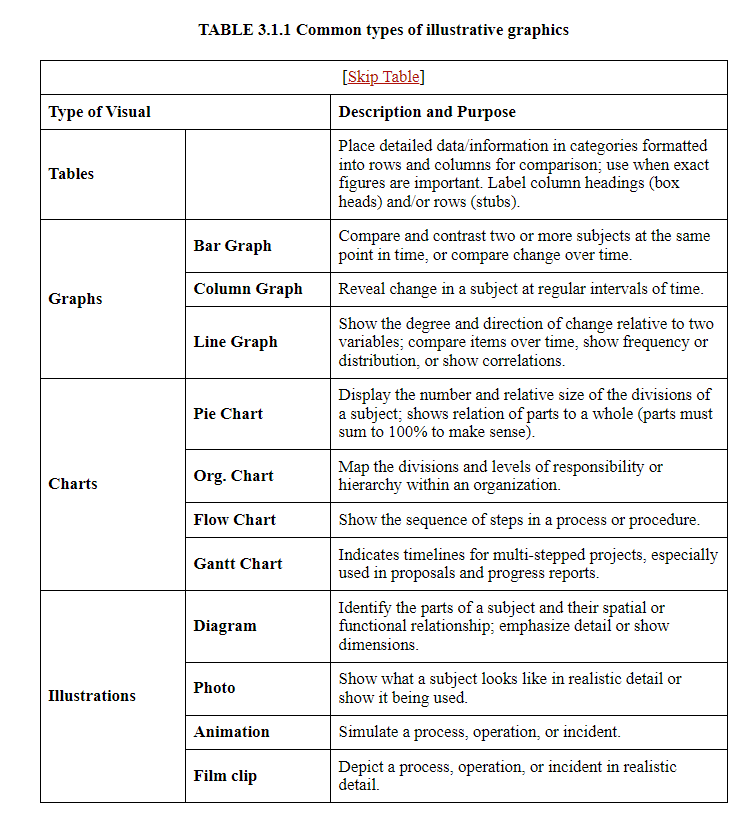
Note. Adapted from Last, Suzan, 2019. University of Victoria. EBOOK ISBN 9781550586657.
This week, you will create two infographics. The first will be a pie chart using Excel and the second will be an image in Word.