
Activity – Excel 13: Formatting Excel data in a Word table
Formatting Excel data in a Word table
[This section should take you around 15 minutes to complete]
Tables used in a Word document are displayed in a way that make the information easier to interpret. For example, all units of measurement should be included in the column heading and in brackets. Only the numbers should be visible in the actual table. You will begin by changing the data from currency to a number before pasting the table into a Word document.
- Click on YourName StudentNumber DigiPrep Excel 12.xlsx spreadsheet in the Taskbar.
- Save As YourName StudentNumber DigiPrep Excel 14.xlsx
- Select all cells containing the sales values (B2:D8).
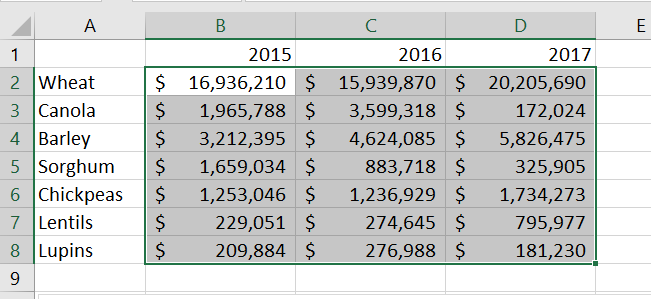
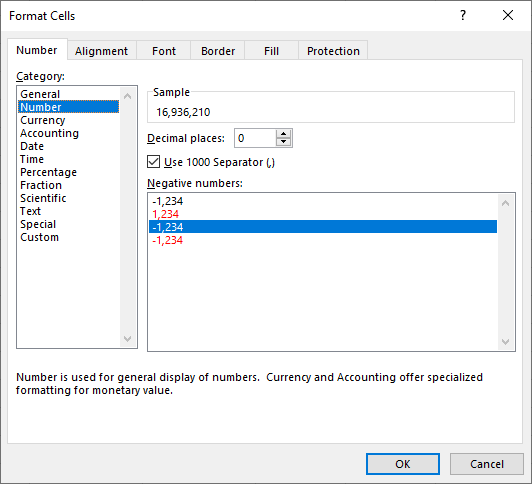
3. Click on the Open Dialog arrow on the Number ribbon to open the Format Cells dialogue box.
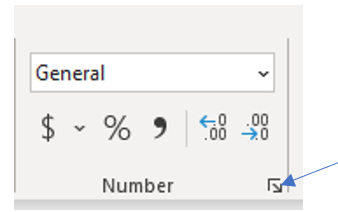
4. Format the data into Number, making sure to select the checkbox next to Use 1000 Separator (,).
5. Open a new blank document in Word and save as YourName StudentNumber DigiPrep Excel 14.doc
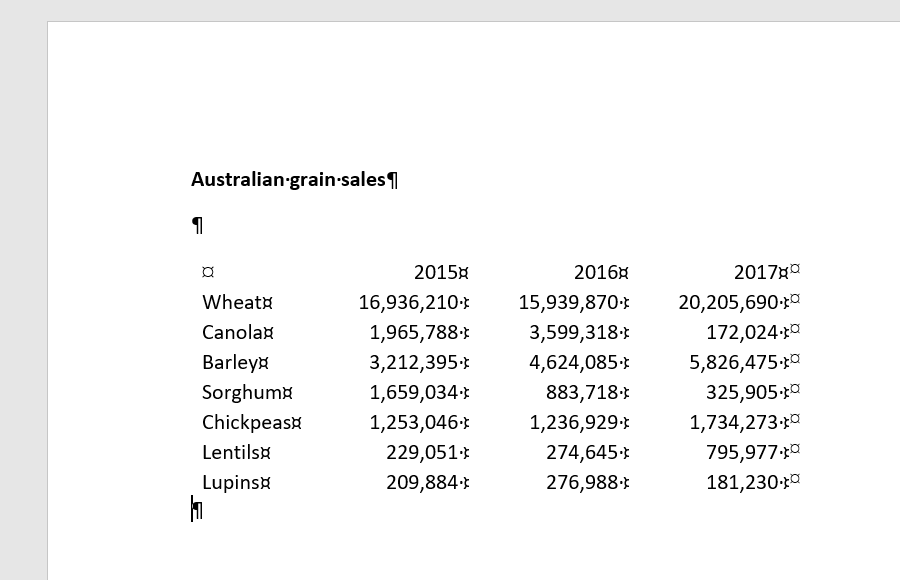
6. Add the heading, Australian grain sales at the top of the page.
7. Press Enter twice to leave two blank lines.
8. From the YourName StudentNumber DigiPrep Excel 14.xlsx spreadsheet copy and paste the table (A1:D8) into the new Word document.
You must now add a row at the top of the table to include information about each column.
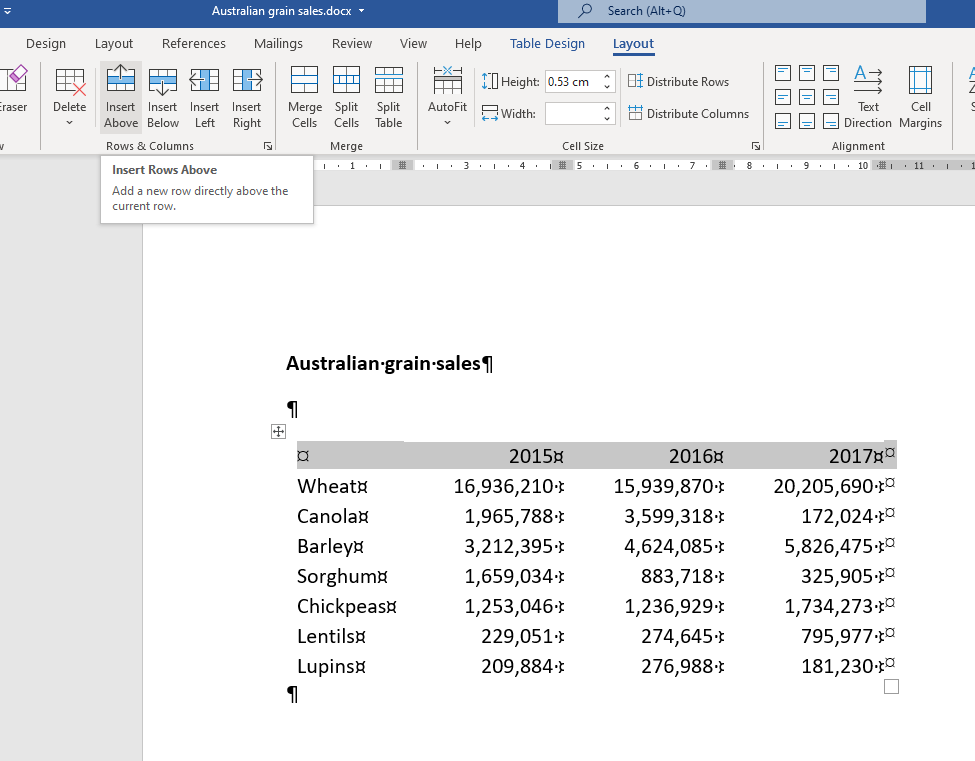
9. Select the top row and use the Insert Rows Above icon from the Layout Ribbon.
10. Select the second, third and last cells of the top row and click on the Merge Cells icon from the Layout Ribbon.
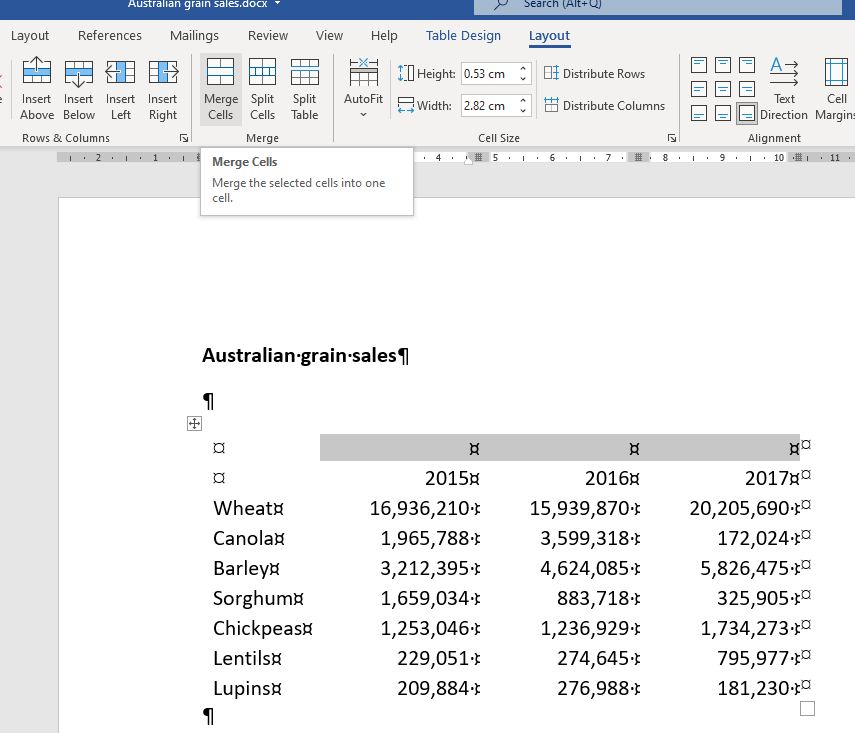
11. Type Annual Sales ($Am) in the merged cell.
When formatting a table in Word, you should include a line to separate each part of the table, including the title, column headings, data, and notes at the bottom. This means that you should not have gridlines or boxes (in the form of borders) in a Word table.
12. Select the top row only and use the Border tool to add a Top and Bottom border on the top row. Hint: you will need to add one border at a time.
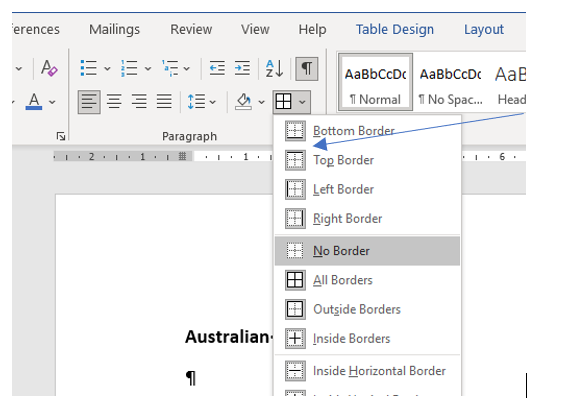
13. Select the last row and use the Border tool to add a Bottom Border.
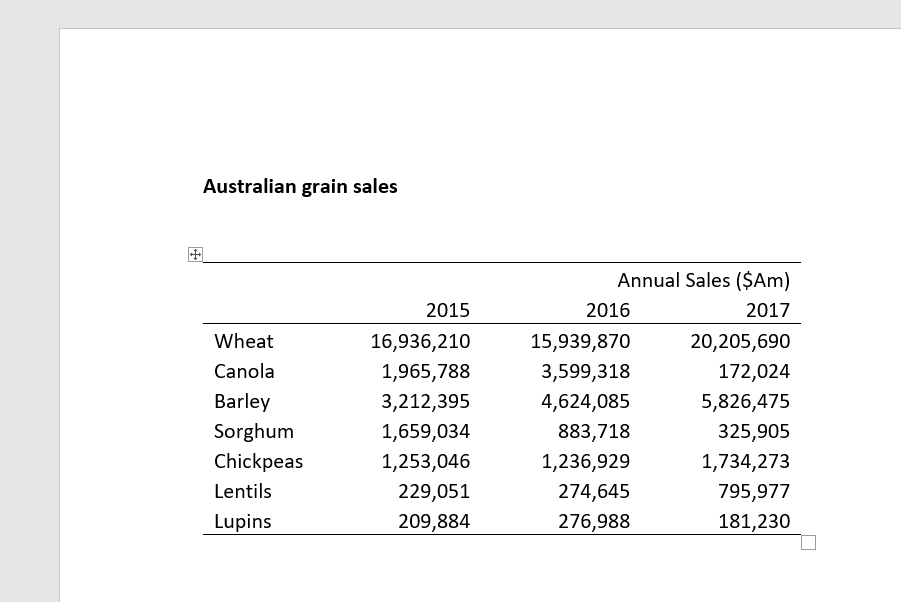
Your table should now look like this.
14. Use your skills to centre align the column headings within their cells.
15. Add a suitable caption at the top of your table.
16. Add a Note with the copyright attribution underneath the table.
17. Save your file and keep it open.
Referring to a table in Word
If you choose to include a table in your document instead of a graph, you must still use the same process to introduce the table and describe the information provided, highlighting important information that you wish to draw to the attention of your reader.
Work through the following exercise to practice summarising, comparing, and contrasting the data in a table. Note that the table contains more information than was depicted in the previous graph. Write your answers in the space provided and then check them with the model answers. As per the previous task, there are no right or wrong answers here, so use this task to practice your writing skills.
Step 1- Introduce the topic
A topic sentence introduces your paragraph and what should be included will vary between disciplines and on the context of the table within your document.
You can browse the source of this information if you would like to do some background reading to assist you to understand the context (https://rdeplan.grdc.com.au/industry-at-a-glance).

Model Answer: Australia exports to many countries and grain exports can be affected by political, economic, social, and technological factors.
Step 5 – Add a conclusion
Step 6 – Combine all your answers into one paragraph.
If we compile all the answers together, it will read:
Australia exports to many countries and grain exports can be affected by political, economic, social, and technological factors. Table 1 summarises Australian grain exports, which include cereals, oilseeds, and pulses for the years 2015 to 2017. Strong demand for pulses (lentils & chickpeas) is resulting in stronger exports, whilst grain exports have fluctuated depending on crop type. Wheat continues to be the top Australian grain export with over twenty billion dollars worth of sales in 2017. Grain production is a significant income for Australia and a better understanding of the drivers for change is required to protect this industry.
18. Copy and paste your paragraph under the heading, Australian grain sales.
19. Save and close your Word file.
20. Upload the completed Word document to the DigiPrep folder on OneDrive.